Managing multiple jobs and feeling the chaos? See a simpler way to stay in control—without bloated enterprise software.
Get a personalized demo →

Ever find yourself asking, “Who’s doing what by when?” You’re not alone.
Most teams juggle spreadsheets, kanban boards, and chat threads to manage projects.
But without a shared timeline, deadlines slip. Handoffs get missed. And projects drift off course.
Gantt charts were built to solve those problems.
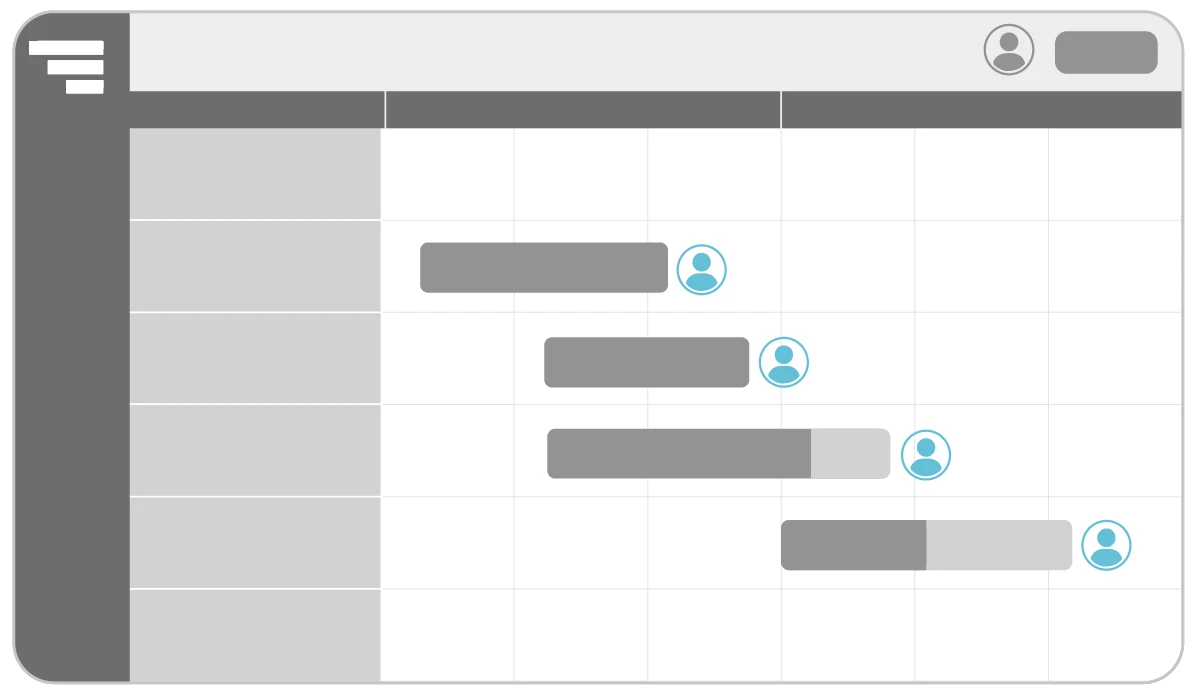
A Gantt chart is a horizontal bar chart used to visualize a project on a timeline.
It displays tasks down the vertical axis and time intervals across the horizontal axis.
Each task appears as a bar that shows when the work starts, how long it should take, when it’s due, and how much progress has been made.
I’ll be honest: Gantt charts used to intimidate me. But once I started using them, I realized how much stress and guesswork they remove from planning.
If you’re new to Gantt charts—or simply want to use them more effectively—this guide walks you through everything step by step.
A Gantt chart turns your project into a visual timeline.
Tasks span the dates when work happens, showing how long each one lasts and where it fits in the flow of your project. As work shifts or progresses, the timeline updates so you always have the most current view of your project.
The horizontal layout makes it easy to understand sequence, timing, and workload at a glance. You can see what’s in progress, what’s coming next, and how changes to one part of the plan affect everything else.
This big-picture view helps teams stay aligned, anticipate risks, and keep projects moving smoothly.
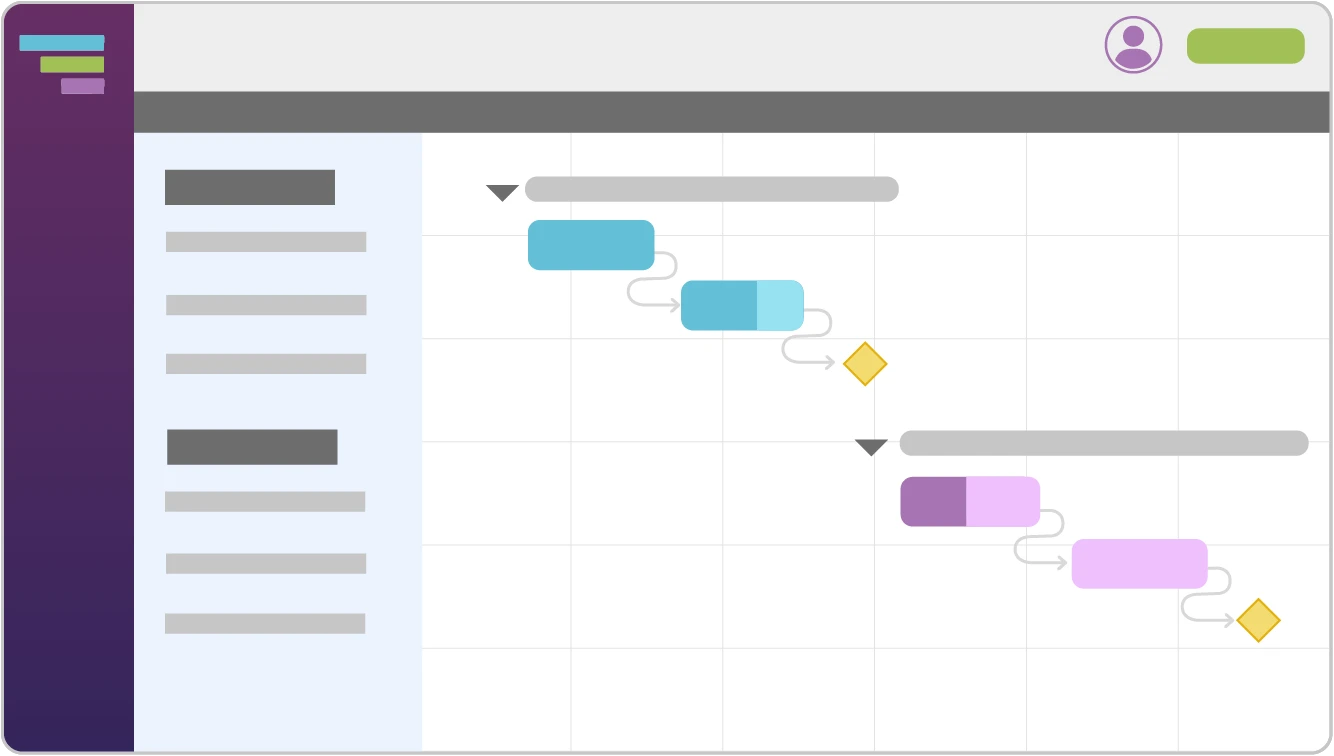
A Gantt chart is made up of several simple pieces that come together to form a clear, visual plan. Understanding each component makes the whole chart easier to read and build.
Let’s take a closer look at the essential parts that make a Gantt chart useful.
The task list breaks the project into clear, manageable pieces.
The task list appears on the left side of the chart and shows every phase, activity, and deliverable in your project. Grouping tasks into logical sections—like Planning, Design, or Site Prep and Framing—keeps your plan organized and easy to follow.
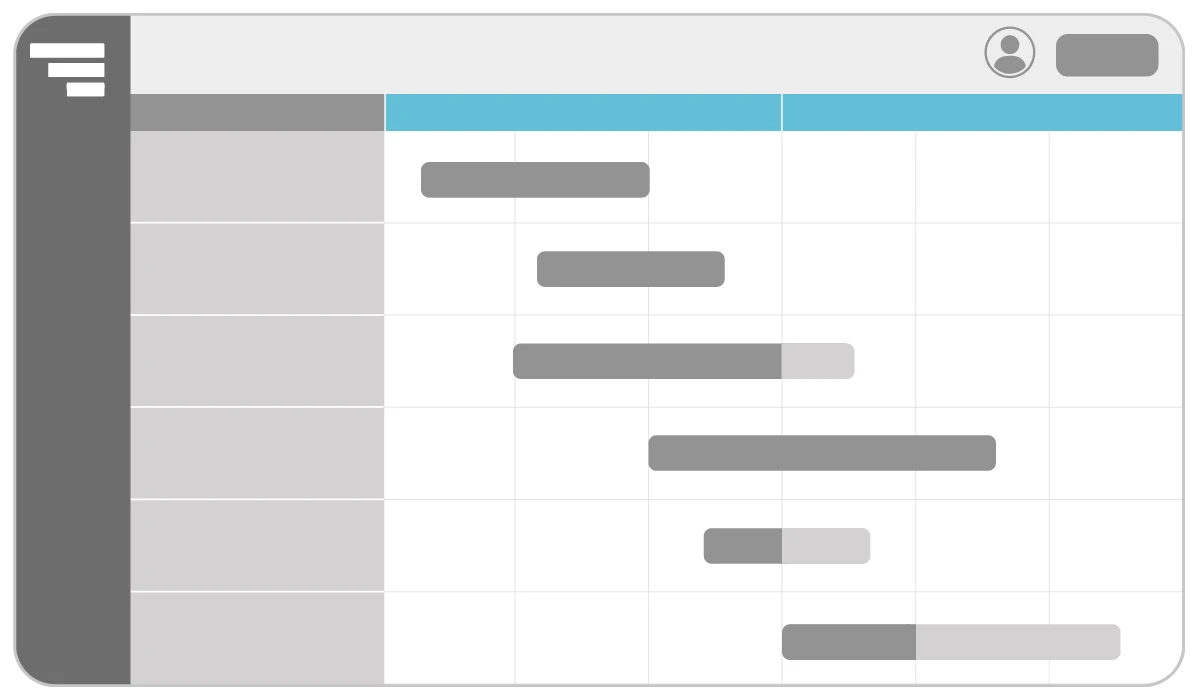
The timeline maps your project across days, weeks, or months.
The timeline runs along the top of your Gantt chart. It shows when work begins, how long it lasts, and when it’s due. You can zoom the timeline in or out to view your project at a daily, weekly, or monthly level.
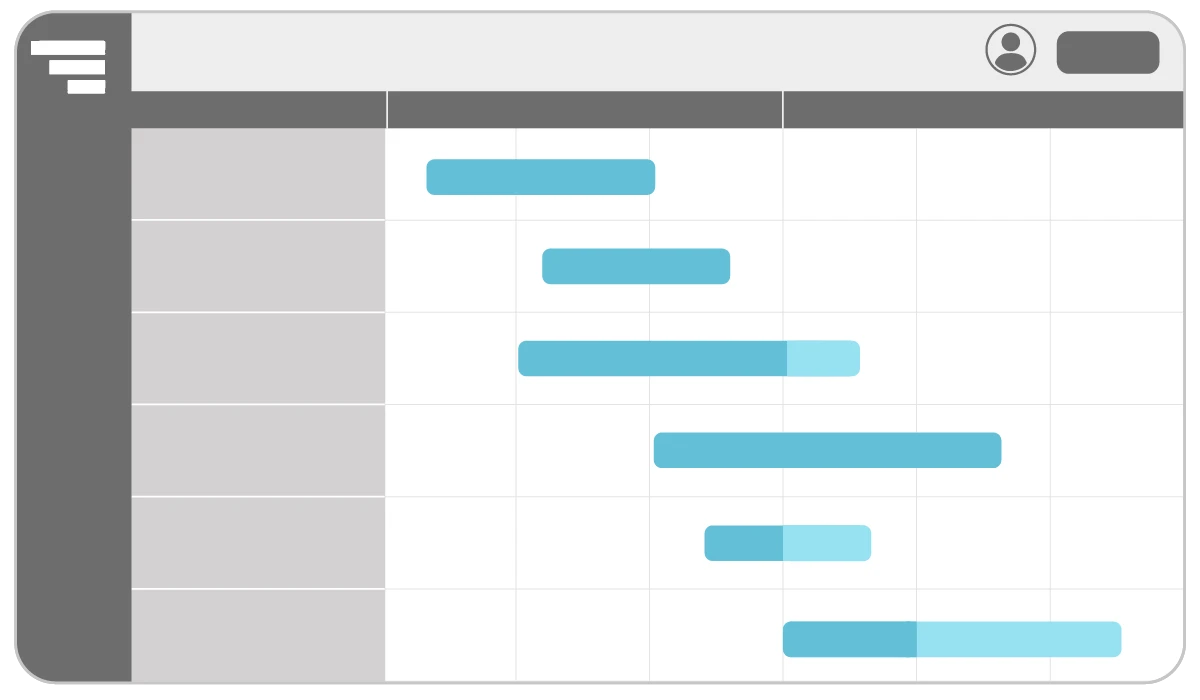
Durations show how long each task is expected to take.
Each task bar stretches across the timeline based on its duration. This makes it easy to see how much time each phase requires—and whether the overall schedule feels realistic.
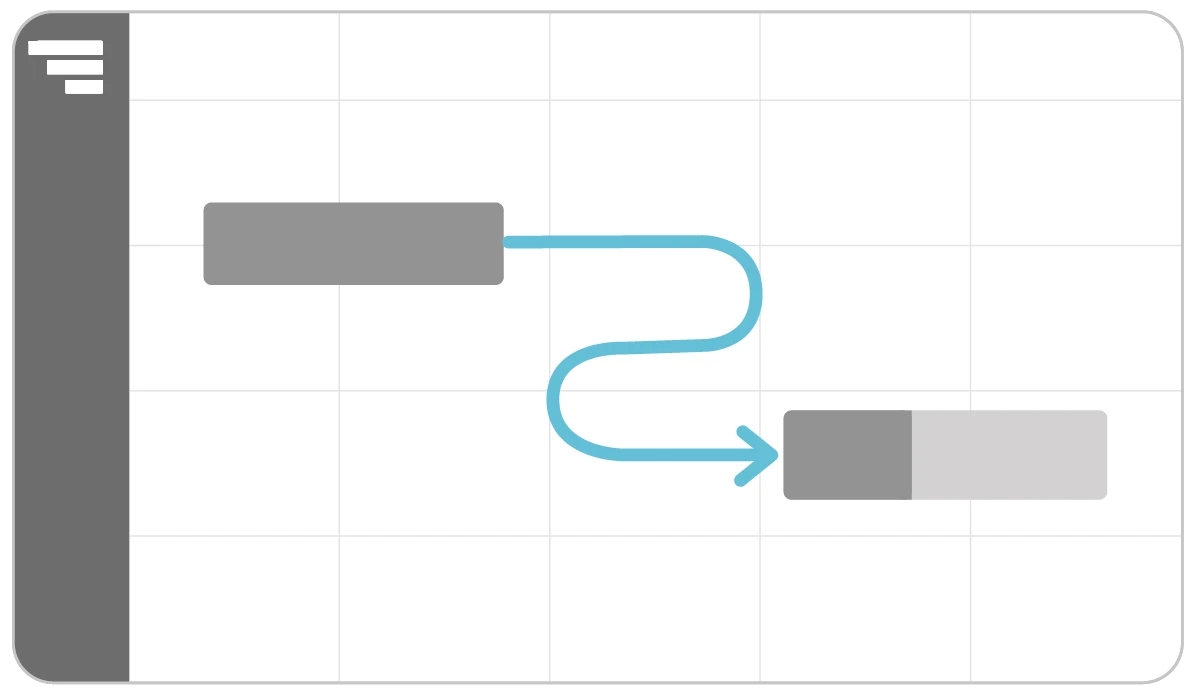
Dependencies show which tasks rely on others before they can start or finish.
Dependencies define the order of work in your project. They make it easy to see how tasks flow together and where timing shifts could create bottlenecks, helping you anticipate risks, manage handoffs, and prevent delays from spreading.
On most Gantt charts, small arrows or connector lines link the task bars so you can see those relationships at a glance.
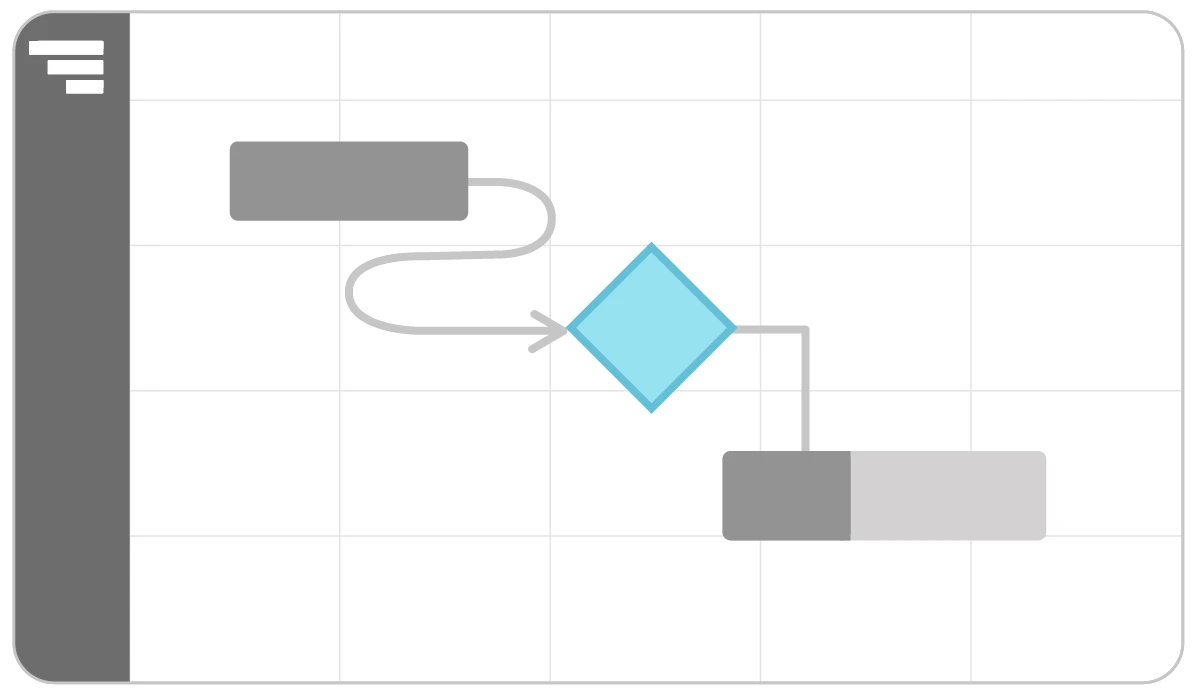
Milestones call out key approvals, deadlines, and handoffs.
Milestones appear as diamond-shaped markers on your Gantt chart. They stand out as anchors on the timeline, helping teams stay aligned on important moments as the project progresses.
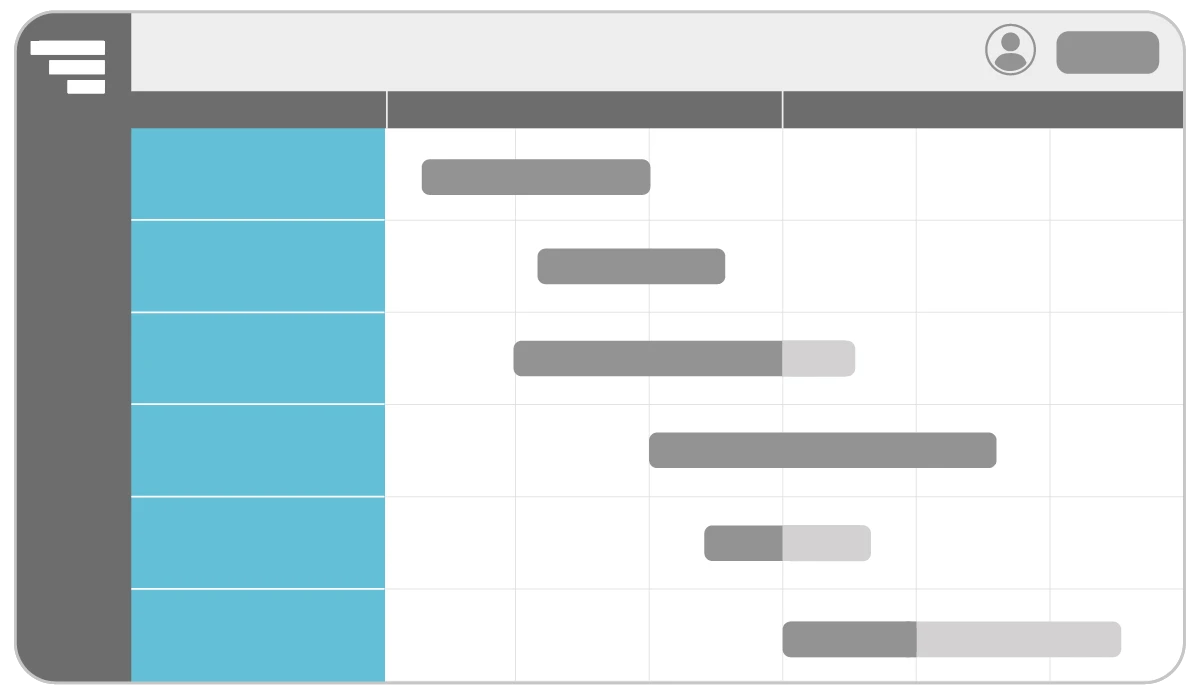
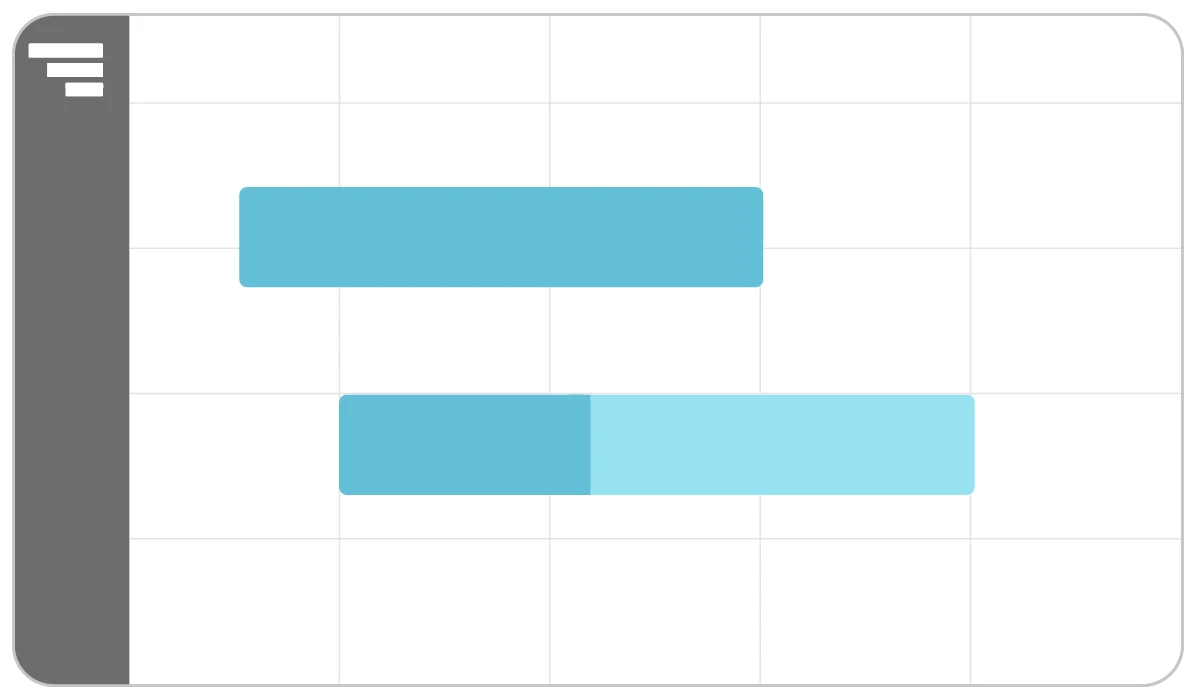
Progress bars show how far along each task is toward completion.
Updating progress as work moves forward makes your plan more accurate and reliable. Filled-in bars help you see what’s done, what needs attention, and where delays could surface so you can adjust timelines and keep everyone informed.
The today line shows exactly where you are in the project timeline.
The today line is a vertical marker that moves with the current date. It gives you instant context for whether work is ahead, behind, or happening right on schedule.

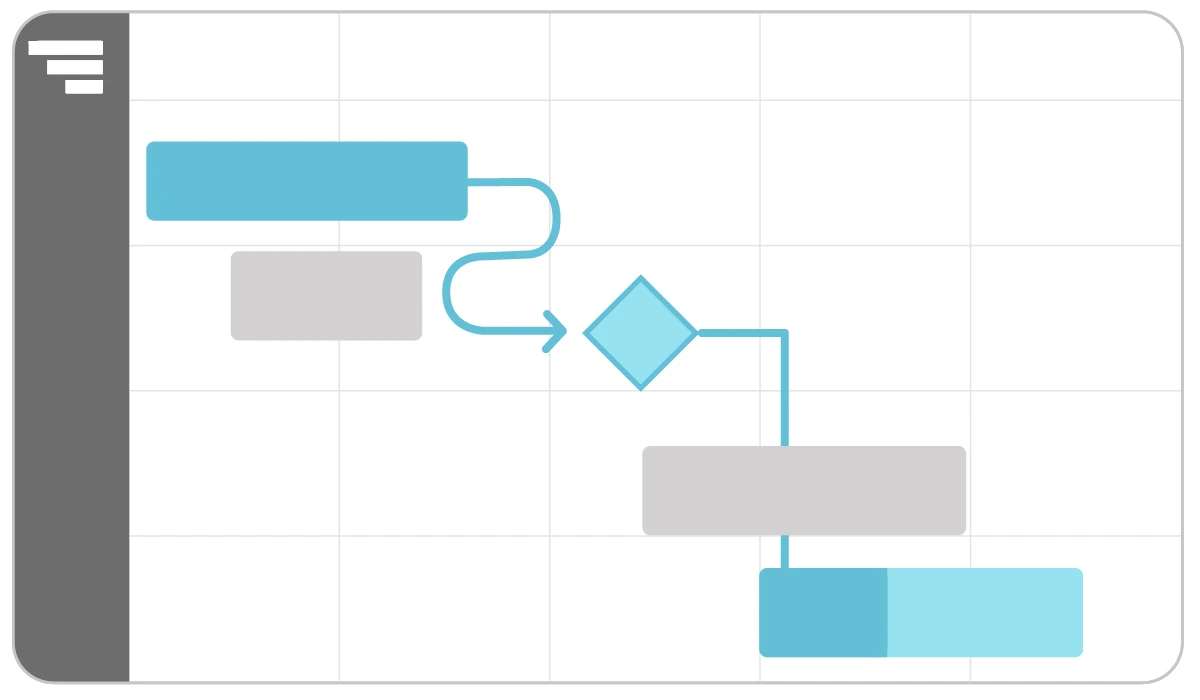
The critical path determines your project’s earliest possible finish date.
Critical path tasks have no wiggle room. If any of them slip, the entire project slips. Understanding this chain of work helps you prioritize tasks, manage risk effectively, and stay ahead of schedule pressure.
A baseline captures your original plan so you can compare it to actual progress.
Saving a baseline creates a snapshot of your initial schedule. Comparing planned vs. actual dates helps you understand how your project is performing and where adjustments may be needed.

Resource assignments show who’s responsible for each task.
Assigning tasks to people—or equipment—clarifies ownership and prevents overload. Resource views help you balance workloads, coordinate schedules, and eliminate conflicts before they disrupt your timeline.
In project management, Gantt charts help teams schedule, track, and communicate deliverables, deadlines, dependencies, and resource assignments. They’re especially useful for complex projects with interdependent tasks that a simple to-do list or Kanban board can’t manage effectively.
Here are a few important benefits Gantt charts provide to projects and teams:
With these benefits, it’s easy to see why Gantt charts are a go-to tool across so many industries. Let’s take a look at who uses them and how.
“TeamGantt allows me to lay out our game plan months in advance. Knowing I’m lining up the right people and the right equipment at the right time is super-critical for my job.”
— Alissa van Overbeeke, ASI Group
Gantt charts help teams across industries coordinate complex work, improve communication, and deliver projects on time.
Here’s how different teams use Gantt charts to get work done:
Busy job sites fall behind when teams aren’t working from the same schedule.
General contractors and project managers use Gantt charts to coordinate crews, avoid scheduling conflicts, and stay ahead of long-lead materials. This structure keeps subcontractors, inspections, and build phases aligned so the project stays on track.
Case study: DayBrook Kitchen and Baths
Design teams juggle multiple disciplines, each with its own timing and deliverables.
Architects and engineers use Gantt charts to organize design phases, coordinate consultants, and manage approval cycles. This visibility keeps revisions, discipline coordination, and permit deadlines on track as complex projects progress.
Case study: Ascent Architecture & Interiors
Creative workflows stall without clear timelines and predictable handoffs.
Gantt charts help marketing teams track campaigns, content production, reviews, and launch dates. Visualizing each deliverable on a timeline makes coordination easier—especially when designers, writers, and stakeholders are all involved.
Agency work shifts constantly as client priorities, scopes, and deadlines evolve.
Agencies often juggle multiple clients and deliverables at once. Gantt charts give teams a clear view of each project’s status, helping them balance workloads, meet deadlines, and communicate progress with clients confidently.
Releases slip when development, QA, and product teams lose their rhythm.
Software teams use Gantt charts to outline feature timelines, testing windows, and release schedules. Even in Agile environments, Gantt charts help teams connect sprint-level work to broader goals and the long-term product roadmap.
Events require tight coordination across vendors, venues, and logistics.
Event and operations teams use Gantt charts to manage bookings, schedule vendors, and organize an event’s many moving pieces. Timelines ensure tasks happen in the right order and nothing falls through the cracks.
Gantt charts aren’t just for project managers. Everyone involved in a project—from individual contributors to executives and clients—relies on the timeline a little differently.
Understanding what each role cares about makes it easier to tailor your chart so it’s useful, clear, and actionable for every person on your team.
"When our PMO first started reporting delays to an executive team, I pulled up the project schedule and explained why that task was delayed and its effect on its dependency. Our CTO said that was the simplest explanation of delay he's ever heard here."
— Josh Gessler, DCCU
Here’s a quick look at what each role typically focuses on—and how a Gantt chart supports their needs.
Now that you know how different roles use Gantt charts, let’s talk about when to use one. Here’s how to tell if a Gantt chart is the right tool for the job.
Use a Gantt chart when:
Gantt charts are powerful, but not every project needs a full timeline. Here’s when a simpler format may work better:

A Gantt chart turns your project plan into a visual timeline you can manage and share. These steps walk you through the core process so you can build a clear schedule in any tool—whether you’re using software like TeamGantt or starting with a spreadsheet.
And don’t worry: If staring at a blank chart feels intimidating, you’re in good company. We’ve all been there.
Here’s the big-picture view before we dive into the details.
A clear scope keeps your plan focused and prevents rework later.
Taking that first step is often the hardest part. I used to spin my wheels trying to figure out where to begin. Scoping out the project before you open a Gantt chart gives you a firm foundation to work from.
Start by outlining what your project needs to achieve. This ensures your Gantt chart focuses on the right work.
Write a short scope statement that summarizes your goals, deliverables, and constraints. Refer back to it if you find yourself adding tasks that don’t align with your core project goals.
If you’re working with clients or a larger team, consider creating a simple project brief instead. It adds structure and gives everyone a shared starting point.
Smaller, well-defined tasks make your timeline easier to estimate and manage.
Once you’ve got your scope in hand, the next challenge is breaking it down into smaller, manageable steps. It’s easy to run in circles trying to strike the right balance between too much and not enough detail.
The key is to think in terms of how the work gets done—not just what needs to happen.
Realistic durations make your schedule dependable.
This is where reality-check mode kicks in. I’ve learned the hard way that underestimating time (especially for tasks you think are “quick”) can derail an otherwise solid plan. Don’t be afraid to build breathing room into your estimates.
Your timeline connects tasks with real dates so the plan becomes real.
Now you’re ready to put the pieces on the Gantt chart! Seeing your plan take shape makes all the prep work worth it.
Just remember: Your job isn’t to impress people with ambitious deadlines. It’s to build a timeline your team can actually stick to.
Dependencies show which tasks rely on others, while milestones highlight key moments on your timeline.
This is where your Gantt chart shifts from a simple schedule to a strategic view of project flow and priorities. Milestones keep you focused on forward momentum, while dependencies help prevent delays from stacking up and derailing your timeline.
Clear ownership keeps the project moving and prevents overload.
Now it’s time to assign the work. This step connects your plan to the people (and equipment) who’ll bring it to life, making roles clear from day one.
Think of this step in 3 passes:
A Gantt chart is most useful when it reflects the current state of the project.
I’ve been on enough projects to know: Overlooking this step is a big mistake. Sharing your plan is one of the most important things you can do to set your project up for success.
Think of it as onboarding your team and stakeholders so everyone understands the plan, feels confident about what’s ahead, and knows where to focus.
Sometimes the easiest way to understand how a Gantt chart works is to see a real project mapped out.
Geraldi and Lechler’s analysis shows that Gantt charts shine in environments with stable, repeatable workflows—making construction one of the places where timelines deliver the most value. Here’s a simple example from the construction world.
Clear sequencing keeps crews, materials, and inspections on track.
Imagine you’re managing a residential renovation. In your Gantt chart, the timeline might start with high-level phases like:
Each phase expands into tasks with durations that show when crews need to be onsite. Dependencies make the sequence clear. For example, drywall can’t begin until plumbing and electrical rough-ins pass inspection.
TeamGantt’s inline material tracking adds another layer of visibility. Long-lead items—like windows, custom cabinetry, or specialty fixtures—sit directly alongside the tasks they support. That makes it easy to see when orders need to be placed to avoid delaying the schedule.

When the team applies a lookahead view, they instantly see the work coming up in the next 2–6 weeks—crews to schedule, inspections to prepare for, and materials that need attention to stay on schedule. This helps everyone stay ahead of bottlenecks and prevents small delays from turning into full-phase setbacks.
Choosing between a PERT chart and a Gantt chart comes down to what you need to understand first: the order of work or the timing of it.
Here’s a simple side-by-side view to help you compare the two.
A PERT chart works well early in planning, especially if your project has a lot of unknowns. It helps you get the flow right before worrying about dates.
A Gantt chart becomes more useful once you’re ready to estimate task durations, set deadlines, and build a schedule your team can follow day to day.
Not every project needs a Gantt chart, and not every tool gives you the full scheduling picture. Here’s how Gantt charts compare to other common formats teams use every day.
Spreadsheets track data. Gantt charts visualize timelines.
Spreadsheets are great for lists, budgets, and calculations, but they struggle with time-based planning. They don’t show how tasks overlap, where handoffs happen, or how delays affect the rest of the work.
A Gantt chart turns those same tasks and dates into a visual timeline. You can see durations, dependencies, and progress in context rather than buried in rows and columns.
Task lists show what to do. Gantt charts show when to do it.
Task lists keep work organized, but they leave out timing. There’s no sense of how long tasks will take, how they connect, or what might block the next step.
A Gantt chart layers those details onto a timeline. It helps you spot bottlenecks, anticipate risks, and build realistic schedules—especially when your team is juggling multiple priorities.
Kanban shows status. Gantt charts show timing and flow.
A Kanban board visualizes the state of work—To Do, In Progress, Done—so teams can manage tasks as they move through the workflow. It’s perfect for daily coordination.
A Gantt chart focuses on timelines and dependencies. It shows how tasks fit together, where deadlines land, and how changes ripple across a project. Many teams use both views together for a complete picture.
"Our organization was looking for a solution that could integrate Gantt charts as well as Kanban boards. TeamGantt has helped us maintain order in our projects for a more agile execution."
— Luis Fabián, Instituto Liberean
You’ve built your Gantt chart and established a solid framework. Now it’s time to make it work even harder for you. These practical tips help you fine-tune your chart, streamline collaboration, and stay in control as your project evolves.
A clear plan is easier for everyone to follow.
Organize tasks into clear phases that align with how your team thinks about the work. Use consistent naming and logical task groupings to reduce confusion and ensure your plan is intuitive for everyone involved.
Your Gantt chart should be as easy to scan as it is to use. Collapse subtasks to simplify high-level views, and apply color-coding to organize tasks visually by priority, team, or workflow stage.
Frequent updates keep your chart reliable.
As you track your plan, look beyond percent complete. Use notes or comments to capture key changes, risks, or blockers. Regularly compare current progress against your baseline to spot trends early and learn from them.
Good schedules consider how much people can actually take on.
Use your chart’s resource views to spot overloads early. Reassign work based on real-time availability—not original plans—to keep your team focused and productive.
Different audiences need different views of the plan.
Use your Gantt chart to drive meetings, update stakeholders, and guide decision-making. Filter views to show only what each audience needs—like milestones for executives or task-level details for the team—and share real-time links to reduce back-and-forth communication.
Even experienced project managers can stumble sometimes. Watch out for these common pitfalls as you build and manage your Gantt chart.
Define “done” before assigning tasks.
Without a clear goal, plans can miss critical deliverables or drift off track. Define success first, then build your Gantt chart around it.
High-risk tasks need breathing room.
Tasks often take longer than expected, especially when they involve unknowns or cross-functional work. Add buffer time to keep your schedule realistic.
Approvals can make or break a schedule.
Skipped reviews can stall deliverables and throw off your entire timeline. Build feedback loops and approval cycles into your plan from the start.
Delays happen when people are stretched too thin.
Ignoring capacity can lead to burnout, missed deadlines, and costly delays. Balance assignments based on who actually has bandwidth—not who you wish did.
Your schedule is only as accurate as your availability.
Deadlines that land on unavailable dates create instant conflicts. Block out holidays, vacations, and known time off early to avoid surprises later.
Tasks go faster when people have the details they need.
Assuming teammates understand a task opens the door to delays. Add notes, links, or docs so everyone knows what’s needed—and why.
A quick review catches schedule-breaking mistakes.
Small errors in durations, dependencies, or ordering can impact the whole project. Have a teammate review your chart before you share it.
Silence slows projects down.
Leaving stakeholders in the dark is a recipe for misalignment and frustration. Share updates early and often—ideally with a live link—so everyone understands changes in real time.
"We invite clients and consultants into the program so they always know what’s happening. No back-and-forth updates—just a live link with the latest timeline."
— Ollie Cooper, Senior Planner, Maddox Planning
At TeamGantt, we use a simple 3-step framework to help teams manage projects more efficiently—whether you’re launching a campaign or building a house.
Plan Up brings structure and rhythm to your workflow in 3 key steps:
Build a clear, complete Gantt chart that maps every phase, milestone, and dependency—just like a blueprint for your project timeline.
Get everyone working from the same live schedule to prevent miscommunication and surface roadblocks sooner.
Update progress, monitor the critical path, and shift timelines as needed to keep your project on schedule.
You’ve covered a lot in this guide. If you want to put your knowledge into practice, here are the easiest ways to keep learning—or start building.
You’ve got the knowledge—now put it to work in a tool built for clarity and collaboration.
Start planning with TeamGantt in minutes.
Unlock all features free for 14 days
Explore advanced scheduling, workload management, dependencies, baselines, and more with a premium trial.
Build a simple Gantt chart, share your timeline, and stay organized—no credit card required.