Managing multiple jobs and feeling the chaos? See a simpler way to stay in control—without bloated enterprise software.
Get a personalized demo →


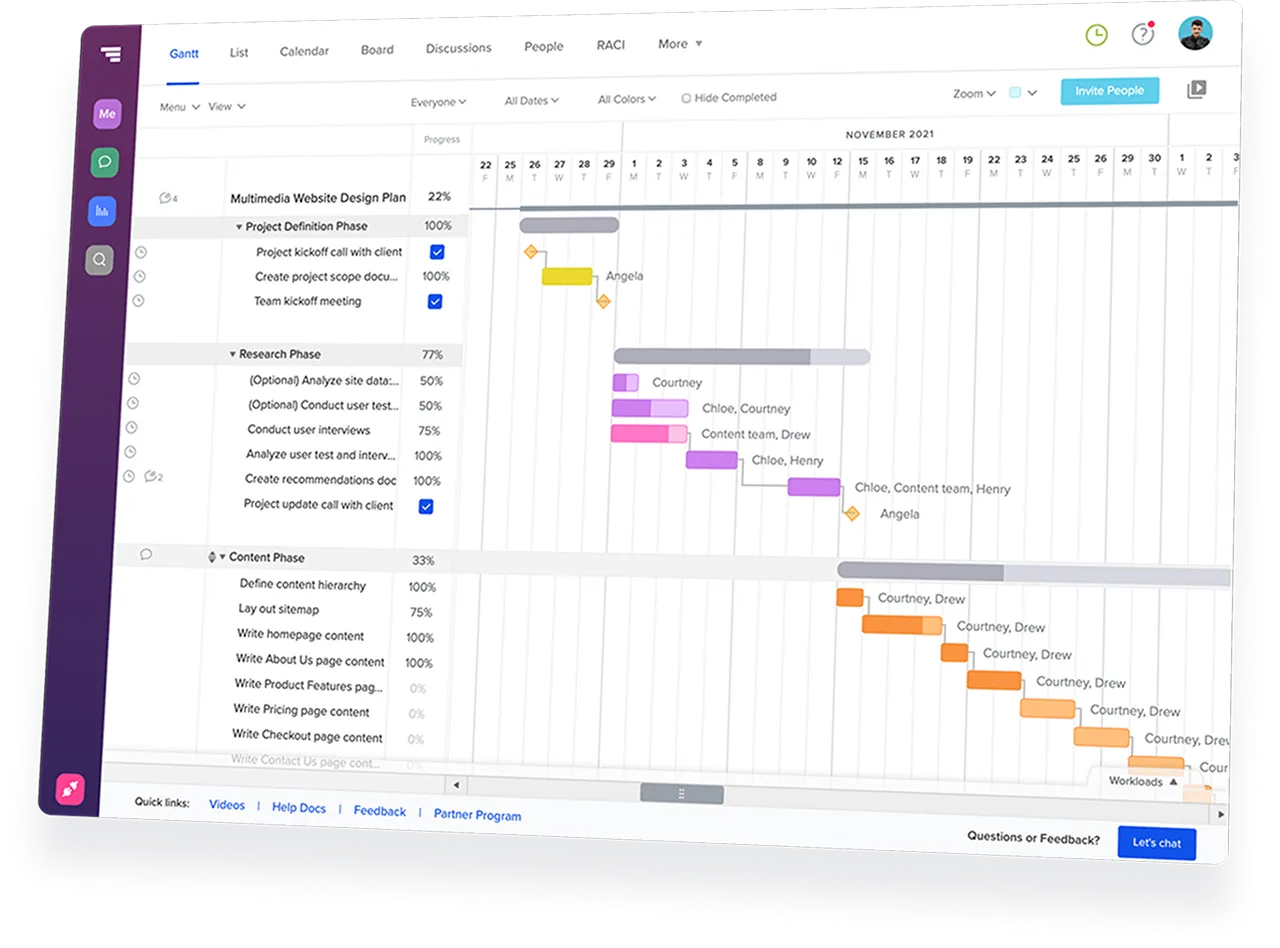
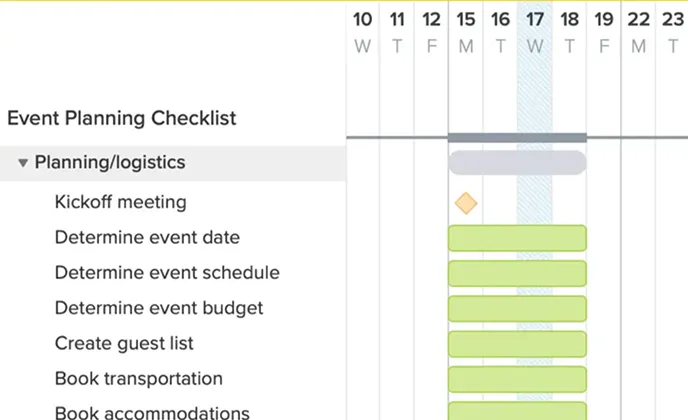
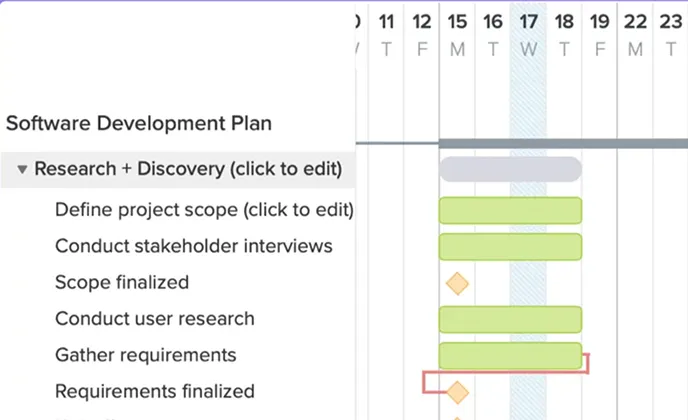
Turn your timeline into a living schedule you can manage and update—in a few clicks.
.webp)
Type a quick prompt to outline your work—or start from a free template.

Get a starting schedule with tasks, milestones, and dependencies.

Adjust your timeline, assign resources, and capture the details that keep work moving.
TeamGantt makes it easy to bring your projects over—so you can hit the ground running and keep teams on track.
Import your first projectTeamGantt takes a fresh approach to Gantt charts—putting clarity, simplicity, and real results first.
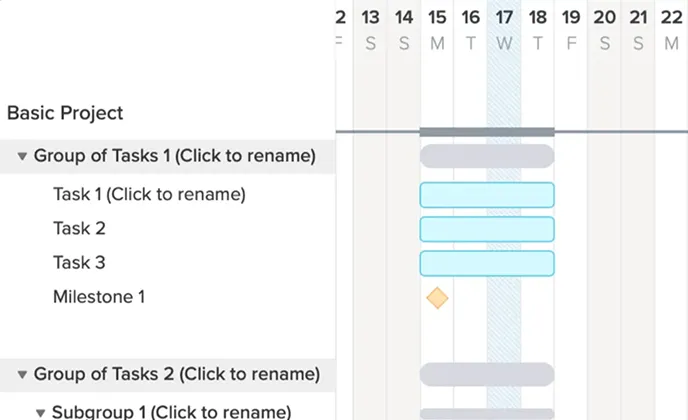
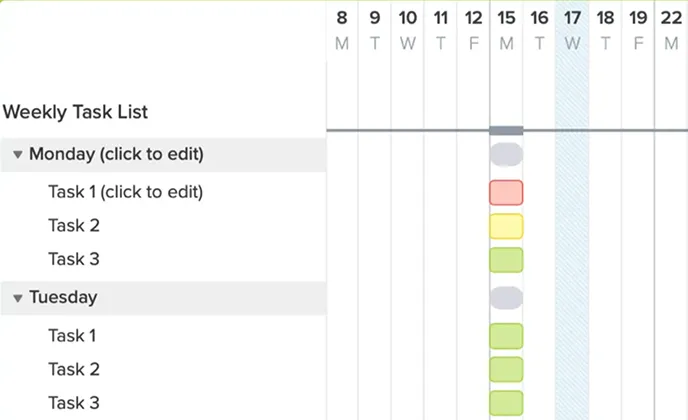
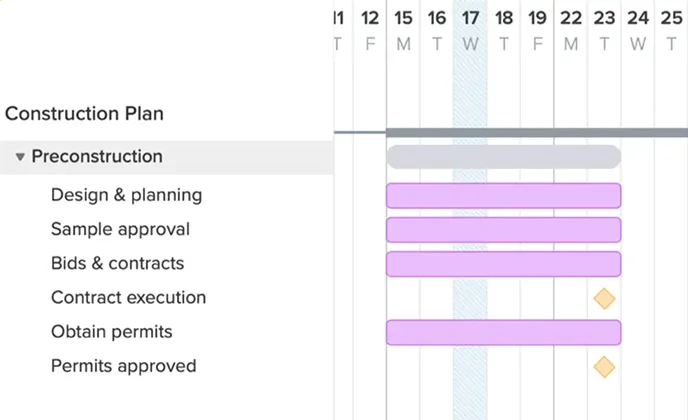
Pick a template, then tweak tasks and dates to fit your schedule.

A Gantt chart is a visual project timeline that maps tasks to dates so you can plan work, see overlaps, and adjust the schedule as things change.
Yes—if you use the right tool. With TeamGantt, you can build a project timeline in minutes with drag-and-drop scheduling or use AI to draft a first version fast. Start from a blank chart, a ready-made template, or import a CSV, MPP, or P6 file. Once your plan is in place, updates stay connected as your schedule changes.
TeamGantt is built around the online schedule—so your timeline stays clear, easy to adjust, and easy to share.
Here’s what that means for you:
Want more control as your needs grow? Explore plans and pricing →
Yes. You can upload a CSV from Microsoft Excel or Google Sheets, or import Microsoft Project (MPP) and Primavera P6 files to get started fast.
Yes. You can use TeamGantt on mobile in a browser, and our iOS and Android apps make it easy to check progress and post updates on the go. Your schedule stays current across devices. For full planning and timeline work, use the web app.
Yes. You can start on a free plan with core Gantt chart features—no credit card required. If you need advanced scheduling and collaboration tools, you can try premium features free for 14 days.
Yes! TeamGantt is completely cloud-based, so it works seamlessly on both Mac and Windows—no downloads required.
Yes. Share a view-only link so anyone can check the latest schedule and status—no login or downloads needed. If you want teammates to collaborate and make updates, you can invite them as users on a paid plan.
Yes. You can start fast with free templates for common projects—like basic timelines, construction schedules, and marketing plans. Just pick a template, tweak it, and get to work.
Yes. TeamGantt’s AI Gantt Chart Maker GPT helps you draft a plan and create a TeamGantt project from it. Nothing is created in TeamGantt until you review and approve. You can edit everything before you publish or share the schedule.
Here’s how it works:
Use a stacked bar chart: List tasks with start dates and durations, insert a stacked bar chart, then hide the start-date series so the duration bars form your Gantt timeline. Next, adjust the date axis so the schedule displays correctly.
Use a stacked bar chart: Enter tasks with start dates and durations, insert a stacked bar chart, then hide the start-date series so the duration bars become your Gantt timeline. Add simple date formulas to keep the schedule updated as dates change.